Compare conversion rates

I would like to compare the conversion rate of entry pages.

Preliminary comment:
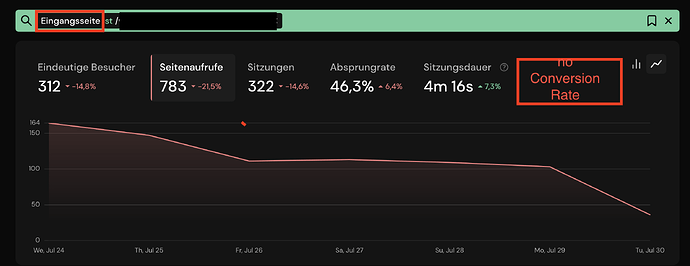
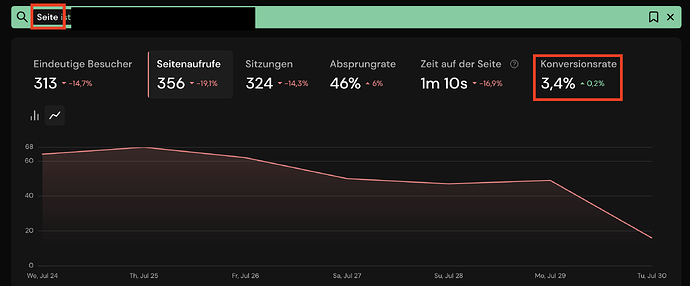
Usually, in web analytics such as GA4 or Matomo, the conversion rate is only indicated for entry pages, not for pages. In Pirsch, this seems to be the opposite. I only get the conversion rate when filtering a page, not a entry page.


But my actual question is this:
I would like to compare the conversion rate of multiple pages. Since the conversion rate is only indicated in the overview above, I cannot do this. Is there a workaround, or do I have to reset a filter for each page I want to compare?

A feature request, if I may:)
Can we get a column in the pages (or entry pages) table for the conversion rate?

Thank you!

Hi Philipp,

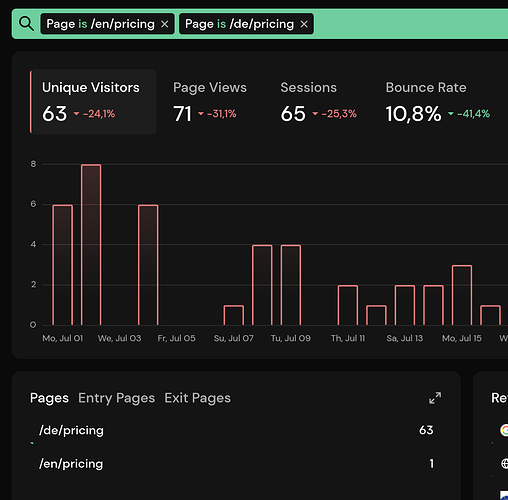
The conversion rate is displayed as “Besucher %” in the list. You can add multiple pages to the filter to compare them from the dropdown.

The numbers for the entry pages would be the same, except if you would like to compare entry rates, which are in the entry pages panel.

Thanks for clarifying this, Marvin.

So the “entry rate/Einstiegsrate” is the conversion rate of entry pages?
→ It is unclear to me what conversion this rate would be referring to. If I filter for a specific goal, the entry rate changes to a number that does not add up.

Or in other words: I have set up 4 goals. How can I see the conversion rate for a specific goal?
(I have tried with various goals but the numbers don’t add up. Setting a filter for the completed goal does not seem to work.)

The CR is always relative to the total number of visitors for the selected period. Unique visitors / total number of visitors for the period.

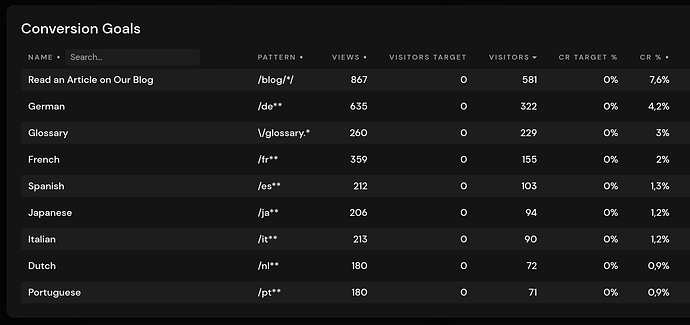
The entry rate is different, as it only counts visitors who entered through that site. Conversion goals track pages only. You can see the conversion rate for them by opening the panel.

I think we could add a graph if you filter for them.

Hi Marvin

Thanks for the hint to the conversions panel. I tried this out, but the numbers don’t quite seem to make sense when I add filters:

  • If I filter the entry pages, the conversion panel adapts. But the numbers are not realistic (pages I know are driving conversions don’t show any conversions in the panel after filtering). When I change the filter from “is” to “contains”, the numbers are more realistic. Might there be a problem with the filter?
  • You mention that “The CR is always relative to the total number of visitors”. Does that mean it never refers to the total amount of filtered entry pages?
  • The CR is often 0%. Adding another decimal point might be useful here.

I am still a bit confused about what I can, and cannot correlate in Pirsch. A tutorial about conversions would be very helpful. Again, here is my use case:

  • I have various goals set up in Pirsch.
  • I want to compare what entry page is most successful in driving a specific conversion. (This means, I can’t use an overall conversion rate, but a conversion rate for a specific goal, referring to specific pages).
  • I should be able to sort this overview (e.g. by highest conversion rate).
  • The conversion rate must refer to each page in the row (Conversions/visits per each page in the row)
  • Optimally, I would have an absolute number of conversions as well as the conversion rate.

Sorry for being complicated, but I cannot get this to work so far:-(

Hi Philipp,

I’ll be on vacation next week, but we can set up a call to talk about your problems after that if you like :+1:

Might there be a problem with the filter?

Hmm, there could be an issue with entry pages in particular. But I need to run some tests to verify this.

Does that mean it never refers to the total amount of filtered entry pages?

I’m not exactly sure what you mean. If you filter for a referrer, entry page, or anything else, the CR adapts and will be lower, because the relative number of visitors is smaller compared to the total number of visitors. The right side of the equation never changes.

  • Without filtering: Unique Visitors on [Page, Referrer, …] / Total Unique Visitors
  • With filtering: Unique Visitors on [Page, Referrer, …] filtered by [Page, Referrer, …] / Total Unique Visitors

You can filter for the entry page, for example, swap to the pages panel, and see the updated conversion rates.

The CR is often 0%. Adding another decimal point might be useful here.

You can hover it to see the unformatted number.

I want to compare what entry page is most successful in driving a specific conversion.

This sounds a lot like a funnel to me:

I should be able to sort this overview (e.g. by highest conversion rate).

The panels are fixed, but in the details view you can sort by (almost all) columns.

The conversion rate must refer to each page in the row

That’s the case.

Optimally, I would have an absolute number of conversions as well as the conversion rate.

Again, this sounds a lot like you would need funnels instead of conversion goals. Conversion goals are basically “cheap” funnels, only showing the last step (target page(s) + optional custom event).

They are useful to group pages and filter for regular expressions, send out an email once reached, but for performance marketing, you need funnels.
Hi Marvin
Good idea, let’s set up a call after your vacation! That way I can show you what exactly I want to achieve. In the meantime, enjoy your vacation!

1 Like

After today’s helpful call with Marvin, I would quickly like to resume the solution:
If you want to compare conversion rates of entry pages, you need to first filter for the desired conversion, and then access the entry pages report. (This is unlike GA4, where you would open the table for landing pages and then be able to compare conversions and CRs).

1 Like